Displaying Trends from Trend Log Multiple Objects
These steps are the same as for 'Displaying Trends from Trend Log Objects' except:
-
You connect each pen (created in step 5) with the same Trend Log Multiple object (selected in steps 6 to 11) – one pen = one trend on the plot
-
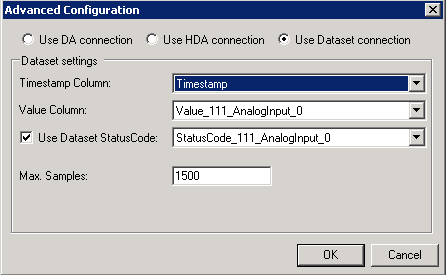
In the Advanced Configuration dialog (step 12 to 15), bind Value and Timestamp columns to data from the appropriate referenced object.
See Also: