Using Buffer Summary View
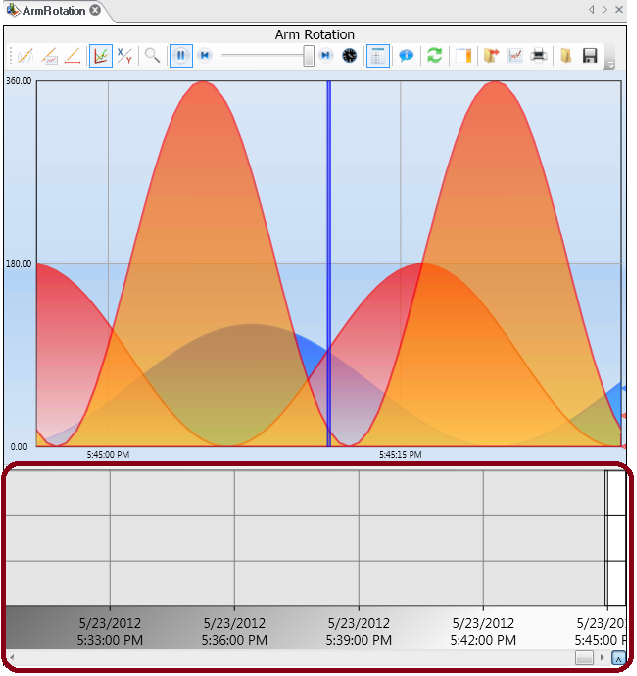
Buffer Summary View is a powerful feature to use while in Freeze mode. By default the Summary View is located at the bottom of the TrendWorX64 Viewer. The buffer Summary pane gives you a method for viewing the entire data collected while moving your detailed view through time.
How to use Buffer Summary View
Before you start to use the Buffer Summary View, you need to configure at least one pen in TrendWorX64 Viewer (see the Working with Trends topic). Once you have a pen configured, you can follow these steps:
- If you are not already in Configuration mode, switch to this mode by clicking the Configure button in the top-right corner of the ribbon or by clicking the Configurebutton in the Mode Switch group on theHomeribbon.
- Click the button on the TrendWorX64 Viewer Configuration ribbon.
- Click the Chart object in the tree navigation area on the left corresponding to the chart under which you like the Summary View to appear.
- Make sure the Summary View check box in the bottom section is enabled, and select the position, as shown below.
Buffer Summary View Check Box

- Add a pen or group of pens to the chart by following the steps in the Working with Trends topic.
- Switch to Runtime mode by clicking the Runtimebutton in the top-right corner of the ribbon or by clicking theRuntimebutton in the Mode Switch group on theHomeribbon.
- Wait for a short period of time (30-45 seconds) while logged data begins to appear across the entire chart.
- Double click the chart to show the
 runtime toolbar.
 - Click the to switch into Freeze mode.
- The Summary View should automatically appear in the position that you indicated in step 4. If it doesn't appear, click the small arrow in the top-right corner or the bottom-right corner (depending on the position you selected in step 4), and the Summary View should appear as shown below.
Buffer Summary View in Freeze Mode

See also:
