SPC Tag Configuration Dialog
|
|
Note: The following information is applicable only to users who have installed a Quality AnalytiX package from the AnalytiX suite. For more information about installing Quality AnalytiX, see the Installing Quality AnalytiX topic. |
The SPC Tag Configuration Dialog allows you to configure the settings associated with a new SPC tag or edit the settings associated with an existing SPC tag. The dialog is divided into the following three sections:
Properties Tab
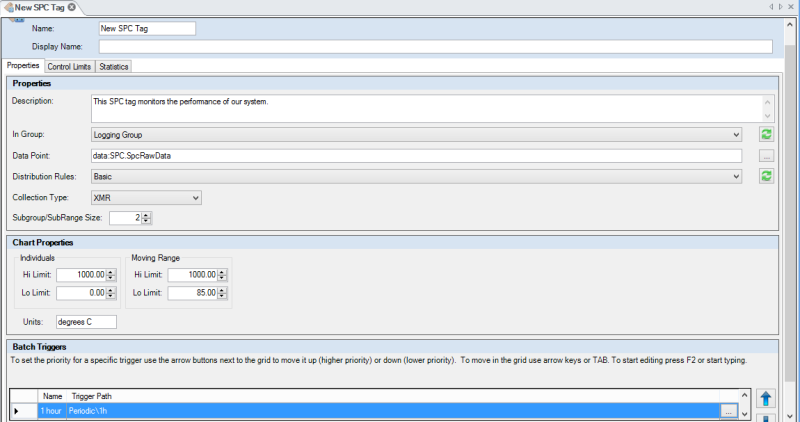
The ![]() Properties Tab allows you to set how an SPC tag is organized within Hyper Historian, the source for the raw data that the SPC tag summarizes, the distribution rules that the tag follows, and the types and triggers for grouping sample values that the SPC tag collects.
Properties Tab allows you to set how an SPC tag is organized within Hyper Historian, the source for the raw data that the SPC tag summarizes, the distribution rules that the tag follows, and the types and triggers for grouping sample values that the SPC tag collects.
-
In the Propertiessection of the tab, enter a Description (optional) for the tag to explain its purpose.
-
For the In Group field, select the logging group with which this tag is associated.

Note: If you have recently created a logging group, you may need to select the Refreshbutton to have it appear in the list of groups underIn Group.
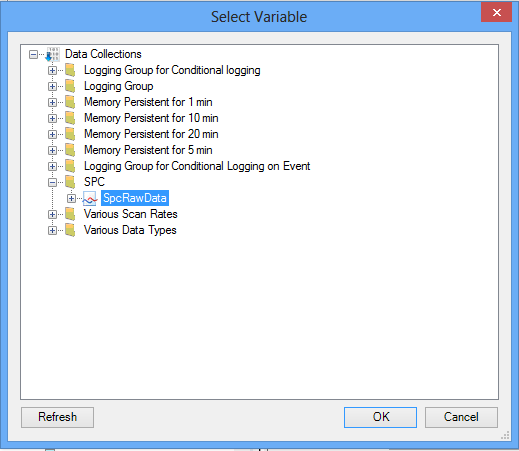
- Click the ellipsis button [...] next to the Data Pointfield to browse for the data source that produces the raw data for this SPC tag. The
 Select Variable dialog appears. It is convenient to use a raw data tag similar to the one you created in the same folder as this SPC tag.
Note: If you have recently created a raw data tag, you may need to select the Refreshbutton in theSelect Variabledialog to be able to select this data tag.
- Select a set of Distribution Rulesfor this SPC tag using the provided drop-down list. Each set of rules defines a set of criteria for determining whether recent SPC tag values reflect an out-of-control process. See the SPC Distribution Rule Sets topic for information on editing existing distribution rule sets or creating new rule sets.
- Optionally select theCollection Type, or the values used to summarize a subgroup of SPC tag samples, using the provided drop-down list. You can select subgroup summary values of mean/range (XBarR), mean/standard deviation (XBarS), median/range (MedianR), or individual data points/moving range (XMR).
- Choose aSubgroup/SubRange Sizeby entering a value into the provided textbox or pressing the up and down arrows to select a value. This field defines the number of samples in each subgroup for the SPC tag. By default, this value is2, indicating that each subgroup contains 2 samples.
- In theChart Propertiessection of the tab, select aHi Limitand aLo Limit for each summary value that appears on the chart summarizing this SPC tag. The summary values that appear in this section depend on theCollection Typeyou have chosen.
Note:If you have left theCollection Typevalue blank, theHi LimitandLo Limitsettings will remain disabled.
- Optionally enter theUnitsassociated with the summary values into the provided textbox.
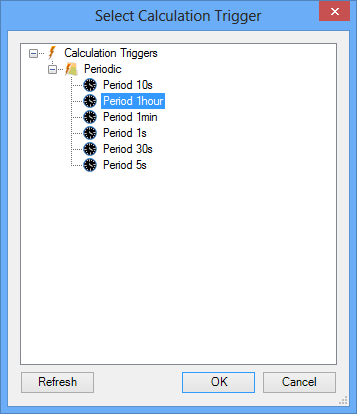
- In theBatch Triggerssection of the tab, you can select one or more calculation triggers that determine when the SPC tag should stop summarizing subgroups within one groups and begin collecting subgroups in a new group. Press the square button on the right-hand edge of theTrigger Path column to open the Select Calculation Trigger dialog.
Note: If you have recently created a calculated trigger, you may need to select the Refreshbutton in theSelect Variabledialog to be able to select this trigger.
- Double-click the text in theNamecolumn to change the default name given to a batch trigger.
- If you have added more than one trigger, you can press the up and down arrow buttons to increase or decrease a trigger's priority. Triggers that appear near the top of the list have higher priority.
- Continue configuring this SPC tag using the settings on the Control limits tab or the Statistics tab.
Control Limits Tab
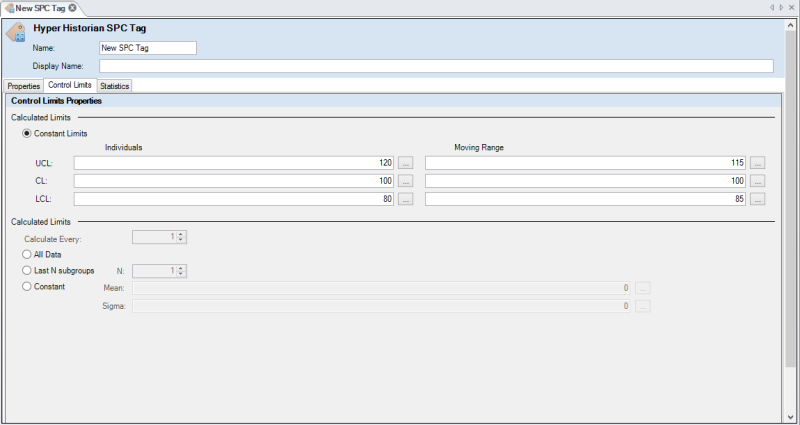
The ![]() Control Limits tab allows you to define the reasonable limits of variation in the values that the SPC tag generates and calculates. Values that fall outside of the limits you define here represent an out-of-control process. Enable the Constant Limits radio button if you wish to define constant values for limits, and enable another radio button if you wish to calculate limits based on the SPC tag values.
Control Limits tab allows you to define the reasonable limits of variation in the values that the SPC tag generates and calculates. Values that fall outside of the limits you define here represent an out-of-control process. Enable the Constant Limits radio button if you wish to define constant values for limits, and enable another radio button if you wish to calculate limits based on the SPC tag values.
|
|
Note: If you have left the Collection Typevalue blank, the settings on this tab remain disabled. |
If you have enabled the "Constant Limits" radio button within the "Control Limits" tab:
- Set the UCL(upper control limit),CL(center line), andLCL(lower control limit) for each summary value that this SPC tag calculates. You can select the ellipsis [...] button to open the Select Variable dialog and choose a dynamic data tag, or you can enter a constant value in the provided textbox.
Note: The names of the variables that appear as columns in this section of the tab depend on the Collection Type you choose in the Properties tab.
- Continue configuring this SPC tag using the settings on the Properties tab or the Statistics tab.
If you have enabled another radio button within the "Control Limits" tab:
-
For the Calculate Everyfield, enter the number of samples that the SPC tag should collect before recalculating the dynamic limits using the provided textbox, or select a value by pressing the up and down arrows next to the textbox. By default, Quality AnalytiX calculates these limits after every sample (Calculate Everyvalue of1).
-
Enable the All Data radio button to use every sample in the most recent group when calculating control limits.
-
Enable the Last N subgroups radio button to use every sample in the most recent set of n subgroups within the most recent group when setting the calculated limits. To specify the number of subgroups to consider when determining the calculated limits, enter a value for N using the provided textbox, or select a value by pressing the up and down arrows next to the textbox. By default, Quality AnalytiX calculates control limits using only the most recent subgroup (N value of 1).
-
Enable the Constantradio button to use a precise set of control limits based on a mean and standard deviation that you define.
- For theMeanfield, select the ellipsis [...] button to open the Select Variable dialog, where you can choose a dynamic data tag to use as the expected mean for the SPC tag's sample values. You can also enter a constant value in the provided textbox.
- Similarly, for theSigmafield, press the ellipsis [...] button to select a dynamic data tag to use as the expected standard deviation for these values, or enter a constant value in the provided textbox.
Note: The effect that the MeanandSigmavalues have on the control limits within Quality AnalytiX depend on theDistribution Rulesthat you have defined in theProperties tab.
- For theMeanfield, select the ellipsis [...] button to open the
- Continue configuring this SPC tag using the settings on the Properties tab or the Statistics tab.
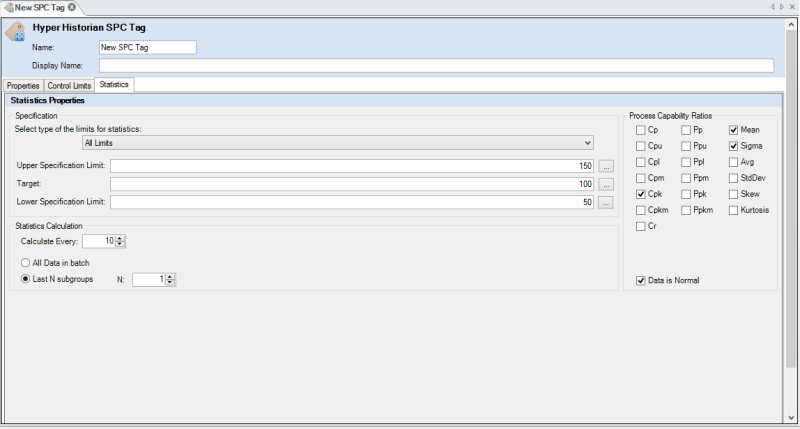
Statistics Tab
The ![]() Statistics tab allows you to configure the number and types of samples to include when Quality AnalytiX calculates summary statistics for this SPC tag, as well as the summary statistics that Quality AnalytiX calculates for the tag.
Statistics tab allows you to configure the number and types of samples to include when Quality AnalytiX calculates summary statistics for this SPC tag, as well as the summary statistics that Quality AnalytiX calculates for the tag.
|
|
Note: If you have left the Collection Typevalue blank, the settings on this tab remain disabled. |
- In the Specificationsection of the tab, use the provided drop-down list to prevent Quality AnalytiX from including SPC tag sample values that fall too far outside a set of specification limits. You can set All Limits, Upper Limits only,Lower Limitsonly, or upper and lower limits with aDefault Target.
- For theUpper Specification Limitfield, select the ellipsis [...] button to open the Select Variable dialog and choose a dynamic data tag. This data tag specifies the maximum SPC tag value that you want Quality AnalytiX to consider when calculating summary statistics. You can also enter a constant value in the provided textbox.
- Repeat step 2 for theTarget field to specify a target sample value that this SPC tag should attain.
- Repeat step 2 for theLower Specification Limitfield to specify the minimum tag value that you want Quality AnalytiX to consider when calculating summary statistics.
Note:Some of the fields described in steps 2-4 might be disabled, depending on the types of limits you specified in step 1.
- In the Statistics Calculationsection of the tab, enter a value in the textbox next to theCalculate Everyfield. This value represents the number of samples that the SPC tag should collect before recalculating summary statistics. You can also select a value by pressing the up and down arrows next to the textbox. By default, Quality AnalytiX calculates these limits after every 10 samples (Calculate Everyvalue of10).
-
Enable the All Data in batch radio button to use every sample in the most recent group when calculating summary statistics.
-
Enable the Last N subgroups radio button to use every sample in the most recent set of n subgroups within the most recent group when calculating summary statistics. To specify the number of subgroups to consider when determining these statistics, enter a value for N using the provided textbox, or select a value by pressing the up and down arrows next to the textbox. By default, Quality AnalytiX calculates summary statistics using only the most recent subgroup (N value of 1).
-
In the Process Capability Ratios section of the tab, enable the check box next to each summary statistic you wish to calculate for this SPC tag. The possible summary statistics include:
- Cp:The process capability, which measures the expected productivity of a processsamplewhose mean lies exactly between its specification limits.
- Cpu:The process capability for a system sample that has only an upper limit.
- Cpl:The process capability for a system sample that has only a lower limit.
- Cpm:Estimate of the process capability index around a specific target value. Also known as the Taguchi capability index.
- Cpk:Estimate of the process capability index for cases where the distribution of sample values is not centered. It is equal to min(Cpu, Cpl).
- Cpkm:Estimate of the process capability index around a specific target value for cases where the distribution of sample values is not centered.
- Cr:The process capability ratio, which estimates the spread of the sample values relative to that of the specification limits. It is equal to 1/Cp.
- Pp:The process performance, which measures the expected productivity of a processpopulation.
- Ppu:The process performance for a system population that has only an upper limit.
- Ppl:The process performance for a system population that has only a lower limit.
- Ppm:Estimate of the process performance index around a specific target value.
- Ppk:The process performance for cases involving non-centered distributions. It is equal to min(Ppu, Ppl).
- Ppkm:The process performance around a specific target value for non-centered distributions.
- Mean:The expected average of the process values.
- Sigma:The expected standard deviation of the process values.
- Avg:The actual average of this SPC tag's sample values.
- StdDev:The actual standard deviation of this SPC tag's sample values.
- Skew:Measures the symmetry of the curve generated by graphing this SPC tag's sample values on a plot. Data that is skewed to the right results in a positive Skew value, and data that is skewed to the left results in a negative Skew value.
- Kurtosis:Measures the relative height of a curve generated by graphing this SPC tag's sample values on a plot. A narrow, sharp curve isleptokurticand contains a Kurtosis value greater than 3. A wide, flat curve isplatykurticand contains a Kurtosis value less than 3. A perfectly Normal peak has a Kurtosis value of exactly 3.
Note: For more detailed information about the different summary statistics available in the Process Capability Ratios section of the tab, see the Statistics Reference topic.
-
Enable the check box next to Data is Normal if this SPC tag's samples follow a Normal (Gaussian) distribution.
-
Continue configuring this SPC tag using the settings on the Properties tab or the Control limits tab.
See also: