Aggregate Groups in Hyper Historian
Introduction
Hyper Historian can log raw data at a very fast rate without compromising performance. It may result in a large amount of data which needs to be further analyzed. In order to speed up the client access Hyper Historian can perform the analysis on the server side and provide the results of the evaluation to the clients. Each such configured evaluation is called an aggregate. In the Hyper Historian Logger’s address space, aggregates are represented as nodes.
A tag's aggregate calculation evaluation runs in the background independently and its results are stored by the Hyper Historian logger based on the parameters defined by the aggregate group.
Configuring Aggregate Group
An aggregate group is the definition of a calculation period for aggregating data. You can have multiple aggregate groups in a logging group. Each Hyper Historian tag can have multiple aggregates configured for it, and each aggregate points to a different aggregate group.
-
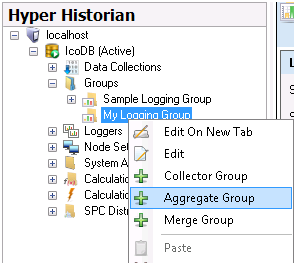
Assuming that you have a Logging Group (e.g. My Logging Group) configured under the Groups folder right-click on it and add an Aggregate Group.
Figure 1 - Adding an Aggregate Group
-
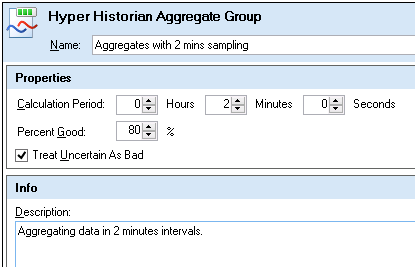
Enter the name of the Aggregate Group. Give it a name that describes what it does.
-
Specify the Calculation period. The Calculation period is the frequency with which the Hyper Historian Logger is to perform the aggregate calculation.
-
Enter a percentage next to Percent Good. If the percentage of good values collected during the calculation period is greater than or equal to this percentage, the aggregate is considered good. The default value is 80%.
-
Enable the Treat Uncertain As Bad check box if you would like collected data with an unknown quality to be considered bad for the aggregate's Percent Good calculation.
-
Enter a description of the aggregate group. Provide enough information so that its precise function is obvious to anyone who may need to maintain it now or later.
-
Click the Apply button to enter the changes.
Figure2- Aggregate Group
Defining Aggregate for Hyper Historian Tag
Tag aggregates are defined for a Hyper Historian tag. In other words, you can configure a Hyper Historian tag to use aggregation.
-
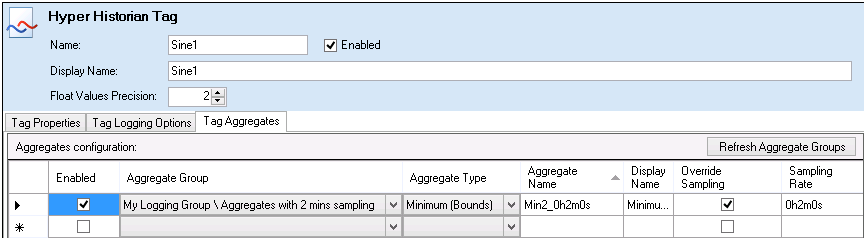
In the Project Explorer, expand the collector group of the tag you want to include in an aggregation (e.g. Sine1).
-
Double-click the tag to open the Hyper Historian Tag form. Go to the form's Tag Aggregates sub-tab as shown below.
Figure3- Tag Aggregates Sub-Tab for the Hyper Historian Tag
-
Select the Aggregate Group from the Aggregate Group drop-down list. The drop-down list contains all of the aggregate groups defined for all collector groups. If you don't see an aggregate group that you recently defined, click the Refresh Aggregate Group button, then look for it again.
-
From the Aggregate Type drop-down list, specify how you want the tag's information to aggregate. See "Aggregate Type Descriptions" below for descriptions of these options. Notice that once you choose the group and type, information in other columns populates.
-
Note that Hyper Historian names the aggregates for you. Each aggregate is given an abbreviated name (in the Aggregate Name column) as well as a display name (in the Display Name column). These names are made up of the Aggregate Type + Aggregate Group. You can modify the name to suit your convention.
-
Make sure you Enable the aggregates, or they won't be collected.
-
If you want to override the sampling rate, you can click a check mark in the Override Sample column. Then change the sampling rate by clicking the ellipsis buttonin the Sampling Rate column and change the rate on the Enter Sampling Rate dialog box that appears.
-
Click the Apply Button to save the changes.
-
You can repeat these steps to add additional aggregates for the current tag or other tags.
-
Once you have finished your aggregate tags configuration, start the Hyper Historian service.
You can view the data logged for each aggregate tag the same way you would for any Hyper Historian tags. In Data Browser, the aggregate is presented as a property of the aggregated tag.
NOTE: Once you add a historical tag to a TrendWorX Viewer, you can also choose aggregates mentioned in this topic. You can still use the viewer to request aggregate values from the HDA server regardless whether you did or did not configure an aggregate in Hyper Historian.
Recalculation of Aggregates
In Hyper Historian, aggregates are calculated in accordance with their calculation period on an ongoing basis. There may be a time at which you will want to recalculate the aggregates that are already stored in Hyper Historian, for example after new historical data is added or historical data has been updated, or a new aggregate was added to a Hyper Historian tag. You can recalculate aggregates by using the Aggregate Tasks Management form, available in Hyper Historian under the System Administration node. You can schedule a task to run at a specific time in the future, or you can run it immediately.
Figure 4 - Re-Calculating Aggregates
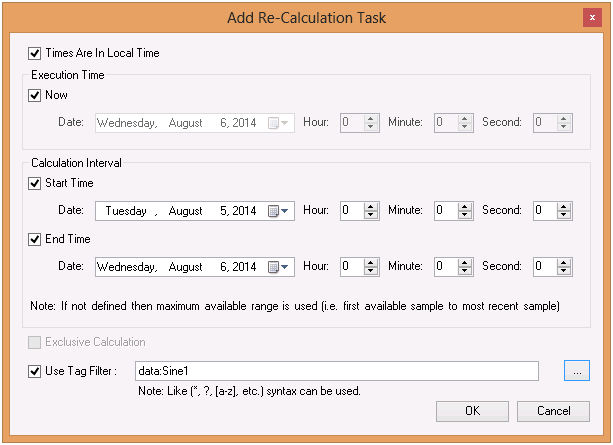
Note. Tasks are stored in a text file that you can update manually or by using an automated process; you are not required to use the Hyper Historian form provided for you in the GENESIS64 Workbench. The Aggregation Tasks file's default location is:
C:\ProgramData\ICONICS\HyperHistorian\Logger\AggregationTasks
Aggregate Type Descriptions
Here is the list of available Aggregate types.
-
Interpolative- [Interpolation Aggregate] - Does not retrieve an aggregate. This is used for retrieving interpolated values.
-
Average- [Data Averaging and Summation Aggregate] - Retrieve the average data over the re-sample interval.
-
Time Average (Interpolated Bounds)- [Data Averaging and Summation Aggregate] - Retrieve the time weighted average data over the interval using Interpolated Bounding Values.
-
Time Average- [Data Averaging and Summation Aggregate] - Retrieve the time weighted average data over the re-sample interval.
-
Sum - Retrieve the sum of the data over the re-sample interval
-
Total (Interpolated Bounds)- [Data Averaging and Summation Aggregate] - Retrieve the value of Time Average (Interpolated Bounds) multiplied by the processing interval of good data (in seconds).
-
Total- [Data Averaging and Summation Aggregate] - Retrieve the value of Time Average multiplied by the processing interval of good data (in seconds).
-
Minimum- [Data Variation Aggregate] - Retrieve the minimum Value in the re-sample interval.
-
Maximum- [Data Variation Aggregate] - Retrieve the maximum Value in the re-sample interval.
-
Minimum Actual Time- [Data Variation Aggregate] - Retrieve the minimum value in the re-sample interval and the Timestamp of the minimum value.
-
Maximum Actual Time- [Data Variation Aggregate] - Retrieve the maximum value in the re-sample interval and the Timestamp of the maximum value.
-
Range- [Data Variation Aggregate] - Retrieve the difference between the minimum and maximum Value over the sample interval.
-
Minimum (Bounds)- Retrieve the minimum good value for each interval as defined for Minimum except that Simple Bounding Values are included.
-
Maximum (Bounds)- Retrieve the maximum good value for each interval as defined for Maximum except that Simple Bounding Values are included.
-
Minimum Actual Time (Bounds)- Retrieve the minimum good value for each interval as defined for Minimum Actual Time except that Simple Bounding Values are included.
-
Maximum Actual Time (Bounds)- Retrieve the maximum good value for each interval as defined for Maximum Actual Time except that Simple Bounding Values are included.
-
Range (Bounds)- Retrieve the difference between the Minimum (Bounds) and Maximum (Bounds) value over the sample interval.
-
Count- [Counting Aggregate] - Retrieve the number of raw Values over the re-sample interval.
-
Number of Transitions-Retrieve the count of the number of transitions that the Variable had during the interval. If one or more raw values are bad, they are not included in the count.
-
Start- [Time Aggregate] - Retrieve the Value at the beginning of the re-sample interval. The time stamp is the time stamp of the beginning of the interval.
-
End- [Time Aggregate] - Retrieve the Value at the end of the re-sample interval. The time stamp is the time stamp of the end of the interval.
-
Delta- [Time Aggregate] - Retrieve the difference between the first and last Value in the re-sample interval.
-
Start (Bounds)- Retrieve the value and status at the StartTime for the interval by calculating the Simple Bounding Values for the interval.
-
End (Bounds)- Retrieve the value and status at the EndTime for the interval by calculating the Simple Bounding Values for the interval.
-
Delta (Bounds)- Retrieve the difference between the Start (Bounds) and End (Bounds) aggregates with the exception that both the start and end must be good.
-
Duration Good- [Data Quality Aggregate] - Retrieve the duration of time in the interval during which the data is good.
-
Duration Bad- [Data Quality Aggregate] - Retrieve the duration of time in the interval during which the data is bad.
-
Percent Good- [Data Quality Aggregate] - Retrieve the percent of data (0 to 100) in the interval which has good StatusCode.
-
Percent Bad- [Data Quality Aggregate] - Retrieve the percent of data (0 to 100) in the interval which has bad StatusCode.
-
Worst Quality- [Data Quality Aggregate] - Retrieve the worst StatusCode of data in the interval.
-
Worst Quality (Bounds)- Retrieve the worst status of the raw values in the interval where a Bad status is worse than Uncertain, which are worse than Good. No distinction is made between the specific reasons for the status.
-
Annotation Count- [Counting Aggregate] - Retrieve the number of Annotations in the interval.
-
Standard Deviation (N-1)- Retrieves value calculated using this Standard Deviation formula, where X is each good raw value in the interval, Avg(X) is the average of the good raw values and n is the number of good raw values in the interval.
-
Variance (N-1)- Retrieves the value of the square of the Standard Deviation (N-1).
-
Standard Deviation (N)- Retrieves value calculated using this Standard Deviation formula, where X is each good raw value in the interval, Avg(X) is the average of the good raw values, and n is the number of good raw values in the interval
-
Variance (N)- Retrieves the value of the square of the Standard Deviation (N).